In cases where there is more than one appraiser in a particular
category (e.g. peers, direct reports etc.) the average score presented
in the report may disguise some important differences in the perceptions
of those who completed the appraisal forms. In order to show the
extent to which the average score represents the views of all
raters in a particular group, the reports I produce can have bars
showing the variability of the responses for each item.
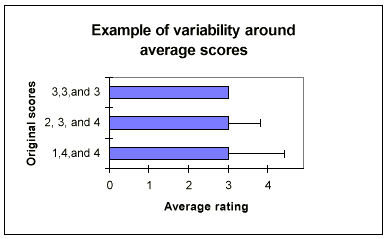
The chart below shows three cases where the average score of 3. In the first case, all three raters score an item 3, giving an average score of 3, and so obviously, there is no variability. In the second case, one rater awards the score of 2, another the score of 3, and the third a score of 4. Notice that this disagreement is shown by the ‘variability bar’ in the chart. In the final example, the average score is still 3, but this time one of the raters disagrees strongly with the other two by only awarding a score of 1, when the other two awarded a score of 4. Notice this time that the variability bar is much longer.
The key thing to remember is that the shorter the 'variability bar', the greater the consensus; the longer the bar, the greater the disagreement.